Product Manager Framework: HEART Framework
When designing for the web, you can analyze usage data for your product and compare different interfaces in A/B tests. This is sometimes called “data-driven design”, but I prefer to think of it as data-informed design — the designer is still driving, not the data.
To make this work in practice it’s important to use the right metrics. Basic traffic metrics (like overall page views or number of unique users) are easy to track and give a good baseline on how your site is doing, but they are often not very useful for evaluating the impact of UX changes. This is because they are very general, and usually don’t relate directly to either the quality of the user experience or the goals of your project — it’s hard to make them actionable.
I’m part of a group of quantitative UX researchers at Google, and we like to think of large-scale data analysis as just another UX research method. We’ve developed a couple of useful methods to help choose and define appropriate metrics that reflect:
-
The quality of user experience (the HEART framework)
-
The goals of your product or project (the Goals-Signals-Metrics process)
The HEART framework
While helping Google product teams define UX metrics, we noticed that our suggestions tended to fall into five categories: -
Happiness: measures of user attitudes, often collected via survey. For example: satisfaction, perceived ease of use, and net-promoter score.
-
Engagement: level of user involvement, typically measured via behavioral proxies such as frequency, intensity, or depth of interaction over some time period. Examples might include the number of visits per user per week or the number of photos uploaded per user per day.
-
Adoption: new users of a product or feature. For example: the number of accounts created in the last seven days or the percentage of Gmail users who use labels.
-
Retention: the rate at which existing users are returning. For example: how many of the active users from a given time period are still present in some later time period? You may be more interested in failure to retain, commonly known as “churn.”
-
Task success: this includes traditional behavioral metrics of user experience, such as efficiency (e.g. time to complete a task), effectiveness (e.g. percent of tasks completed), and error rate. This category is most applicable to areas of your product that are very task-focused, such as search or an upload flow.
These can be applied at a number of levels — from the whole product to a specific feature. For example, in Gmail we might be interested in adoption of the product in general, but also in adoption of key features like labels or archiving.
We are often asked: “Why measure adoption and retention when you can just count unique users?”. It’s definitely important to count how many users you had in a given time period (e.g. seven-day active users). But if you measure adoption and retention as well, you will be explicitly distinguishing new users from returning users, so you can tell how quickly your user base is growing or stabilizing. This is especially useful for new products and features, or those being redesigned.
You don’t necessarily need to create metrics in all of these categories — you should choose the ones that are most important for your particular project (see the Goals-Signals-Metrics process in the next section). The HEART framework can help you decide whether to include or exclude a particular category. For example, engagement may not be meaningful in an enterprise context where users are expected to use the product every day as part of their work. In this case a team may choose to focus more on happiness or task success. But it may still be meaningful to consider engagement with specific features of the product, as an indicator of their utility.
We’ve applied the HEART framework to a wide range of projects within Google, and we’ve found it a very useful tool for focusing discussions with teams. The acronym helps make it memorable, and it’s easy to facilitate an informal discussion by quickly writing the categories on a whiteboard.
The Goals-Signals-Metrics process
How do you get from the HEART categories to metrics you can actually implement and track? Unfortunately, there’s no off-the-shelf “HEART dashboard” that will magically do this for you — the most useful metrics are likely to be specific to your particular product or project.
Goals
It’s tempting to start thinking about metrics by simply brainstorming a long list, but this can quickly get unwieldy and hard to prioritize. Ideally, you want a small set of key metrics that everyone on the team cares about. To figure out what those are, you need to start at a higher level: identify your goals so you can choose metrics that help you measure progress towards those goals.
It can be surprisingly hard to articulate the goals of a project, and this is where the HEART categories are particularly useful in discussion. At YouTube, for example, one of our most important goals is in the engagement category: we want our users to enjoy the videos they watch, and keep discovering more videos and channels they want to watch. You might have different goals for a particular project or feature than for the product as a whole. For YouTube Search, a key goal is in the task-success category: when a user enters a search, we want them to quickly and easily find the videos or channels that are most relevant.
A common pitfall is to define your goals in terms of your existing metrics — “well, our goal is to increase traffic to our site.” Yes, everyone wants to do that, but how will user-experience improvements help? Are you interested in increasing the engagement of existing users or in attracting new users?
You may not realize that different members of your team have different ideas about the goals of your project. This process provides an opportunity to build consensus about where you are headed.
Signals
Next, map your goals to lower-level signals . How might success or failure in the goals actually manifest itself in user behavior or attitudes? For example, an engagement signal for YouTube might be the number of videos users watch on the site — but an even better one might be the amount of time they spend watching those videos. A failure signal in the “Task Success” category for YouTube Search might be entering a query but not clicking on any of the results.
There are usually a large number of potentially useful signals for a particular goal. Once you have generated some promising candidates, you may need to pause and do some research or analysis to help you choose.
First, how easy or difficult is each signal to track? Is your product instrumented to log the relevant actions, or could it be? Could you deploy an in-product survey on a regular basis? If you’re interested in task-success metrics, one option is using assigned tasks in a usability benchmarking study, which you can also do on a large scale.
Second, you should choose signals you expect to be sensitive to changes in your design. If you’re already collecting potentially useful signals, you can analyze the data you have and try to understand which signals seem to be the best predictors of the associated goal.
Metrics
Once you’ve chosen signals, you can refine those further, into metrics you’ll track over time or use for comparison in an A/B test. In the YouTube engagement example, we might implement “how long users spend watching videos” as “the average number of minutes spent watching videos per user per day.”
At this point, the specifics depend a lot on your particular infrastructure. But as in the previous step, there may be many possible metrics you could create from a given signal — you’ll need to do some analysis of the data you’ve already collected to decide what’s most appropriate. You will probably need to normalize raw counts to make them more meaningful, for example by using averages or percentages.
The Goals-Signals-Metrics process should lead to a natural prioritization of the various metrics — it’s most important to track the metrics related to your top goals. Avoid the temptation to add “interesting stats” to your list. Will you actually use these numbers to help you make a decision? Do you really need to track them over time, or is a current snapshot sufficient? Stay focused on the metrics that are closely related to your goals to avoid unnecessary implementation effort and dashboard clutter.
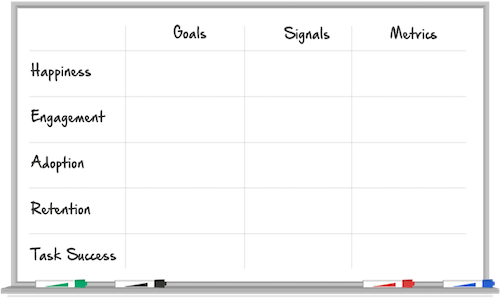
You can try drawing a worksheet like this one to help you work through the steps. You don’t need to include all the HEART categories if some don’t make sense for your project, and of course, feel free to add more categories of your own.
Image from Digital Telepathy’s animated version of this article.
If you want your product’s design to be informed by large-scale data, it really helps to have metrics that reflect the quality of the user experience, and that map closely to your main goals. Try using HEART and Goals-Signals-Metrics to help you get there, and let us know how it went. Do you have your own methods for doing this, or advice to share?
Source: library.gv.com